SAR sensors are echo-localization systems. They measure the time between the emission of an electromagnetic pulse and its reception after that it have been backscattered by targets. This time is firstly converted in distance and then in pixels. The coordinates of a target in the image correspond to the number of resolution cells included in the distance: it is an integer. But the SAR signal keep in memory the sub pixel length of the path between the emission and the reception. One way this memory is kept is through the phase of the pixel. Indeed, the pixels of SAR images are complex numbers.
The SAR images are often represented in amplitude only because the information conveyed in the amplitude is the most easily interpretable: the amplitude of the pixels represents the energy of the backscattered signal. A metallic structure as the Eiffel Tower will backscatter most of the emitted pulse and thus be very bright in the image. On the contrary, the Seine river does not scatter signal back to the satellite. It is thus dark in the image. On the other hand, the phase of a unique image is completely random.
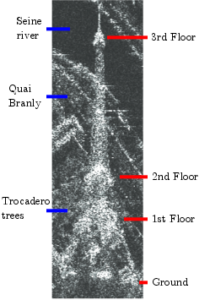
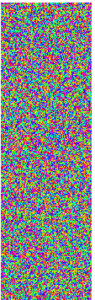
Amplitude image of the Eiffel Tower and its phase
The magic happens when the phase of at least two images are compared. The phase difference that is computed can bring information of the height of the targets if the images are acquired from slightly different location. This technique is called interferometry. The phase difference can also bring information on the deformation of the target between the acquisition if the images are acquired at different time. This technique is called differential interferometry. When the images are acquired from slightly different location and at different time, both height and deformation are mixed in the phase difference. The proportion of the mixing depends on the acquisition condition.
When it comes to buildings, deformations are often neglected: the height of the buildings is considered as proportional to the phase difference. Since the phase is 2π-periodic, the height can only be estimated modulo the ambiguity height. The ambiguity height is determined by the acquisition parameters. For example, it is inversely proportional to the distance between the two satellites but proportional to the satellites’ altitude or the wavelength of the pulse. To estimate to absolute height, the phase need first to be unwrapped.
The images below are 2 interferograms between TerraSAR-X Spotlight images (thanks to the DLR projet LAN2708). The unwrapping of the phase can be done roughly by counting the fringes: the color legend is 2π-periodic, each color rainbow represents a fringe. We count approximately 6.5 fringes on the image on the left. With an ambiguity height about 46 meters, the measured height is 278, close to the 320m official height of the Eiffel Tower and its antennas. On the image on the right, 4 fringes can be counted. But ambiguity height is now of 412 meters leading to a 1600m Eiffel Tower. This surprising result is caused by the non-deformation hypothesis. Indeed, the Eiffel Tower is moving of few centimeters between the acquisitions, mostly due to thermal effects and this deformation impact the phase.
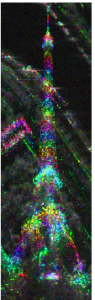
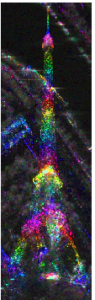
Left : ambiguity height of 46m , Right ambiguity height of 412m