The Eiffel Tower is an emblematic monument in Paris. I have studied it through a temporal stack of 100 images acquired by TerraSAR-X in spotlight mode (thanks to the DLR projet LAN2708). See how it looks in SAR imagery. The image has a 1m x 1m resolution: one pixel represents roughly a 1m x 1m ground area. This means that targets that are separated by 1m in the scene will be separated in the image.
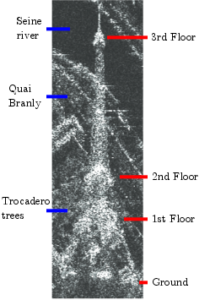
To make an image, the SAR sensor emits pulses of electromagnetic waves and record the backscattered signal. On the contrary to most optical satellite, the SAR sensor has an oblic view making the side of the Eiffel Tower visible. We can thus see the different parts of the structure of the Eiffel Tower, as well as some buildings, the Seine river and the Trocadero. As in optic, some objects can block the wave, creating shadow behind them. I have cut the shadow of the Eiffel Tower, but the shadow of nearby buildings is visible.
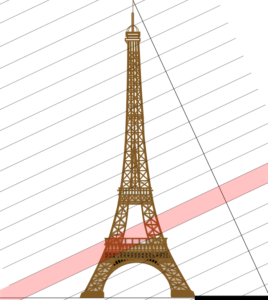
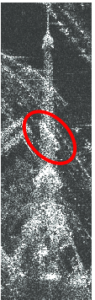
This image is a good illustration of the layover effect. Since SAR sensor is an echo-localisation technique, the treatment that creates the image, the synthesis, is based on the measure of the distance between objects as the Eiffel Tower and the satellite. Thus all the objects that are at the same distance to the satellite will be in the same pixel. The 3rd floor of the Eiffel Tower and the Seine river appear in the same pixels as well as the 2nd floor and the trees of the Trocadero.
The synthesis is based on the assumption that all the object in the scene are static. When objects are moving during the acquisition, they can be defocalized or delocalized depending on the direction of their mouvement. A peniche boat that was moving on the Seine river is thus delocalized on the quai Branly.
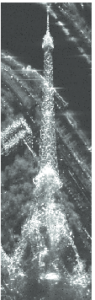
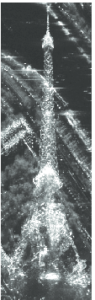
Due to the interaction of the emited wave with rough objects, speckle is present in SAR images. Speckle looks like a salt and pepper noise on homogeneous areas. Its effect can be removed by averaging pixels through the temporal stack. The average can be quadratic (left) or geometrical (right). The two averages look mainly alike, even if the contrast is sharper on the quadratic mean. Some differences appear on the Seine river. They are due to changes in few images of the temporal stack: mostly peniche boats that are present only in one date. These changes are erased by the geometrical mean but still impact the quadratic mean.