PhD supervision
Flora Weissgerber (ONERA, DTIS, SAPIA)
Florence Tupin (Télecom Paris – LTCI, Institut Polytechnique de Paris)
Sara Fleury (LEGOS, CNRS)
Start date October 2025
PhD description
Arctic sea-ice extent has been decreasing since the 90’s, which speeds up the warming of the Arctic ocean since sea-ice insulates the ocean from the atmosphere and has a high albedo reducing the absorbed heat. To model this processus at a fine-scale, high resolution maps of sea-ice thickness are needed. The sea-ice thickness maps are currently produced from altimetric sensors such as SIRAL on board CryoSat-2 [Laxon2013, Kurtz2014] or AltiKa on board Saral [Zakharova2015], that measure elevation points of the sea-ice floes and the leads along the satellite track, leading to a very sparse spatio-temporal coverage. For instance, to get a full Arctic coverage a month of data is needed (http://www.cpom.ucl.ac.uk/csopr/seaice.php). Thanks to the new mission SWOT, launched by CNES and NASA, 3D images of sea ice have been available since 2023. Its ATLAS swath-altimeter provides the topography of the sea ice over a width of 120km with a horizontal resolution of 250m (https://www.aviso.altimetry.fr/en/news/idm/2024/mar-2024-sea-ice-as-seen-by-swot.html). However, its recent launch means that it is not yet possible to reconstruct the evolution of the sea ice under the effect of global warming.

In this PhD, part of the SITEMSA ANR project, our goal is to obtain SWOT-like altimetric measurement by combining nadir altimetry measurements with Sentinel-1 (S1) SAR images. These images have a spatial resolution of 10 to 50 meters but don’t directly measure sea-ice thickness. However, they are used to map sea-ice types [Park2020]. Building on the link between sea-ice thickness, its roughness and the roughness measured on SAR images, they have already been used to extrapolate altimetric measurement at a basin scale [Karvonen2022]. By applying such a link locally, and building on the deep-learning advances, we aim to extend the altimetric measurement over a few hundred meters guided by the SAR images. To do so, multiple research questions are raised :
- Is it possible to get a sea-ice floes/leads mapping at the native resolution of SAR images?
- Can we build on this map to produce sea-ice elevation maps with only few regression points available?
- Can temporal data be used to robustify the sea-ice elevation maps?
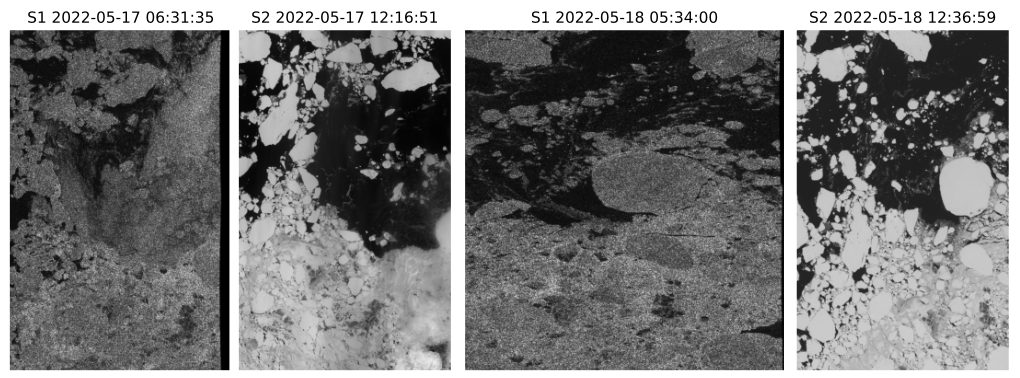
Having labels for a sea-ice floes/leads semantic segmentation sea-ice mapping on SAR images is challenging. Optical images can be used to provide labels by ice-floe segmentation [König2020], but only few cloud-free Sentinel-2 (S2) multispectral images are available per year to get the pixel-based sea-ice floe labeling. Moreover, since the two images are not acquired at the same time, a sea-ice drift compensation will need to be applied and uncertainty in the label taken into account. An example of two pairs of S1 and S2 images acquired on the same day, separated by 1 day is shown in the following figure.

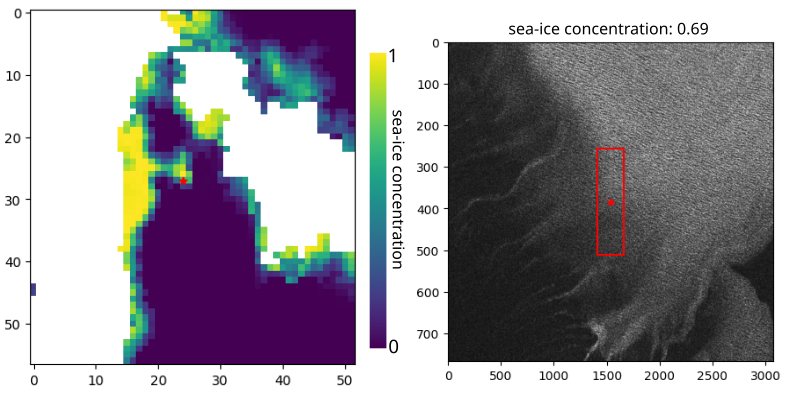
However, sea-ice concentration is widely available at a low spatial-resolution either from manually drawn ice-chart or ASMR-2 measurements. Sea-ice concentration gives the percentage of sea-ice floes versus leads in pixels or manually drawn regions. This data can be used to produce Sea-ice concentration maps using deep-learning dataset, such as the AI4Arctic [AI4Arctic], that offer S1 GRD images linked with concentration maps. These types of data have been successfully used in deep-learning frameworks [DeGélis2021]. In this PhD, we aim to remove the probabilistic aspect of sea-ice concentration to get sea-ice floes/leads maps building on weakly supervised learning. Features extracted either from a sea-ice concentration classification task [Ahlswede2022] or a denoising algorithm such as SAR2SAR [Dalsasso2021] adapted to EW sea-ice data [Méraoumia2024], can then be used to obtain sea-ice floes/leads maps. Moreover a dataset linking S1 SLC data to concentration is being constructed in the SITEMSA. An example of a corregistrated ASMR-2 measurement and S1 EW SLC data is shown in Figure 3. This dataset would enable the use of the MERLIN denoising algorithm [Dalsasso2022] whose features have been shown to contain enough information to perform building semantic segmentation [Dalsasso2024].

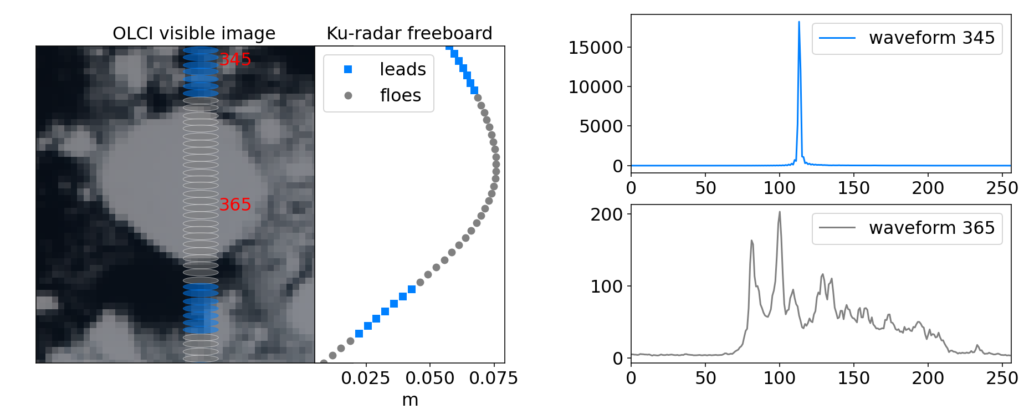
It has already been proven beneficial in urban remote sensing to estimate the height and the classes of pixels conjointly [Carvalho2019], and optical images have already been used to densify LiDAR point cloud depth measurement [Qiu2019]. However, the challenge for sea-ice elevation is that only few measurement points will be available for supervision as shown in Figure 4, where the footprints of the altimetric measurement of the Sentinel-3 (S3) SRAL instrument are represented on their corresponding S3-OLCI visible image acquired at the same time. The altimetric measurements could be used in an iterative framework using the existing map as coarse resolution labels to get a first training and refining it using sparse annotation [Lenczner2022].The used of the features of MERLIN could also guide the regression algorithm, as it has been done in urban areas [Dalsasso2024].

Part of the SITEMSA project aims at measuring sea-ice drift to co-registrate SAR, optical and altimetric data. In this PhD, these algorithms could also be used to combine multiple SAR and altimetric acquisition to robustify the sea-ice elevation retrieval algorithm. Another way to combine these approaches would be to link the feature extraction in the sea-ice floe mapping, the elevation regression task and the drift measurement, to robustify the three tasks.
The obtained elevation maps will be validated using SWOT data. Obtaining SWOT-like data for point-like altimeters will enable us to keep the temporal depth of the altimetric measurement. This is crucial for sea-ice evolution analysis under the effect of global warming.
Candidate profile
We are looking for candidates with a master’s degree or the equivalent within the fields of signal and image processing and deep-learning. Good statistical skills and coding skills (python) are required. An interest in physics and climate sciences, with a focus on sea-ice, is an advantage
References
[AI4Arctic] Saldo, Roberto; Brandt Kreiner, Matilde; Buus-Hinkler, Jørgen; Pedersen, Leif Toudal; Malmgren-Hansen, David; Nielsen, Allan Aasbjerg; et al. (2020). AI4Arctic / ASIP Sea Ice Dataset – version 2. Technical University of Denmark. Dataset. https://doi.org/10.11583/DTU.13011134.v3
[Ahlswede2022] S. Ahlswede, N. T. Madam, C. Schulz, B. Kleinschmit and B. Demir, “Weakly Supervised Semantic Segmentation of Remote Sensing Images for Tree Species Classification Based on Explanation Methods,” IGARSS 2022 – 2022 IEEE International Geoscience and Remote Sensing Symposium, Kuala Lumpur, Malaysia, 2022, pp. 4847-4850, doi: 10.1109/IGARSS46834.2022.9884676.
[Carvalho2019] Marcela Carvalho, Bertrand Le Saux, Pauline Trouvé-Peloux, Frédéric Champagnat, Andrés Almansa. Multi-Task Learning of Height and Semantics from Aerial Images. IEEE Geoscience and Remote Sensing Letters, IEEE – Institute of Electrical and Electronics Engineers, 2019, ⟨10.1109/LGRS.2019.2947783⟩. ⟨hal-02386074v2⟩
[Dalsasso2021] E. Dalsasso, L. Denis and F. Tupin, “SAR2SAR: A Semi-Supervised Despeckling Algorithm for SAR Images,” in IEEE Journal of Selected Topics in Applied Earth Observations and Remote Sensing, vol. 14, pp. 4321-4329, 2021, doi: 10.1109/JSTARS.2021.3071864.
[Dalsasso2022] E. Dalsasso, L. Denis and F. Tupin, “As If by Magic: Self-Supervised Training of Deep Despeckling Networks With MERLIN,” in IEEE Transactions on Geoscience and Remote Sensing, vol. 60, pp. 1-13, 2022, Art no. 4704713, doi: 10.1109/TGRS.2021.3128621.
[Dalsasso2024] E. Dalsasso, C. Rambour, L. Denis and F. Tupin, “Learning a versatile representation of SAR data for regression and segmentation by leveraging self-supervised despeckling with MERLIN,” EUSAR 2024; 15th European Conference on Synthetic Aperture Radar, Munich, Germany, 2024, pp. 1265-1270.
[DeGélis2021] I. de Gélis, A. Colin and N. Longépé, “Prediction of Categorized Sea Ice Concentration From Sentinel-1 SAR Images Based on a Fully Convolutional Network,” in IEEE Journal of Selected Topics in Applied Earth Observations and Remote Sensing, vol. 14, pp. 5831-5841, 2021, doi: 10.1109/JSTARS.2021.3074068.
[Karvonen2022] Karvonen, J. and Rinne, E. and Sallila, H. and Uotila, P. and Mäkynen, M. “Kara and Barents sea ice thickness estimation based on CryoSat-2 radar altimeter and Sentinel-1 dual-polarized synthetic aperture radar”, The Cryosphere, Volume 16, Issue 5, 222, pp 1821-1844, doi: 10.5194/tc-16-1821-2022
[Kurtz2014] Kurtz, N. T., Galin, N., & Studinger, M. (2014). An improved CryoSat-2 sea ice freeboard retrieval algorithm through the use of waveform fitting. The Cryosphere, 8(4), 1217-1237.
[König2020] Marcel König, Matthias P. Wagner, and Natascha Oppelt “Ice floe tracking with Sentinel-2”, Proc. SPIE 11529, Remote Sensing of the Ocean, Sea Ice, Coastal Waters, and Large Water Regions 2020, 1152908 (20 September 2020); https://doi.org/10.1117/12.2573427
[Laxon2013] Laxon, S. W., Giles, K. A., Ridout, A. L., Wingham, D. J., Willatt, R., Cullen, R., … & Davidson, M. (2013). CryoSat‐2 estimates of Arctic sea ice thickness and volume. Geophysical Research Letters, 40(4), 732-737.
[Lenczner2022] G. Lenczner, A. Chan-Hon-Tong, B. Le Saux, N. Luminari and G. Le Besnerais, “DIAL: Deep Interactive and Active Learning for Semantic Segmentation in Remote Sensing,” in IEEE Journal of Selected Topics in Applied Earth Observations and Remote Sensing, vol. 15, pp. 3376-3389, 2022, doi: 10.1109/JSTARS.2022.3166551.
[Méraoumia2024] https://ujm.hal.science/ujm-04720114
[Park2020] Park, J.-W., Korosov, A. A., Babiker, M., Won, J.-S., Hansen, M. W., and Kim, H.-C.: Classification of sea ice types in Sentinel-1 synthetic aperture radar images, The Cryosphere, 14, 2629–2645, https://doi.org/10.5194/tc-14-2629-2020, 2020.
[Qiu2019] Jiaxiong Qiu, Zhaopeng Cui, Yinda Zhang, Xingdi Zhang, Shuaicheng Liu, Bing Zeng, Marc Pollefeys; Proceedings of the IEEE/CVF Conference on Computer Vision and Pattern Recognition (CVPR), 2019, pp. 3313-3322.[Zakharova2015] Elena A. Zakharova, Sara Fleury, Kévin Guerreiro, Sascha Willmes, Frédérique Rémy, Alexei V. Kouraev & Günther Heinemann (2015) Sea Ice Leads Detection Using SARAL/AltiKa Altimeter, Marine Geodesy, 38:sup1, 522-533, DOI: 10.1080/01490419.2015.1019655

Leave a Reply